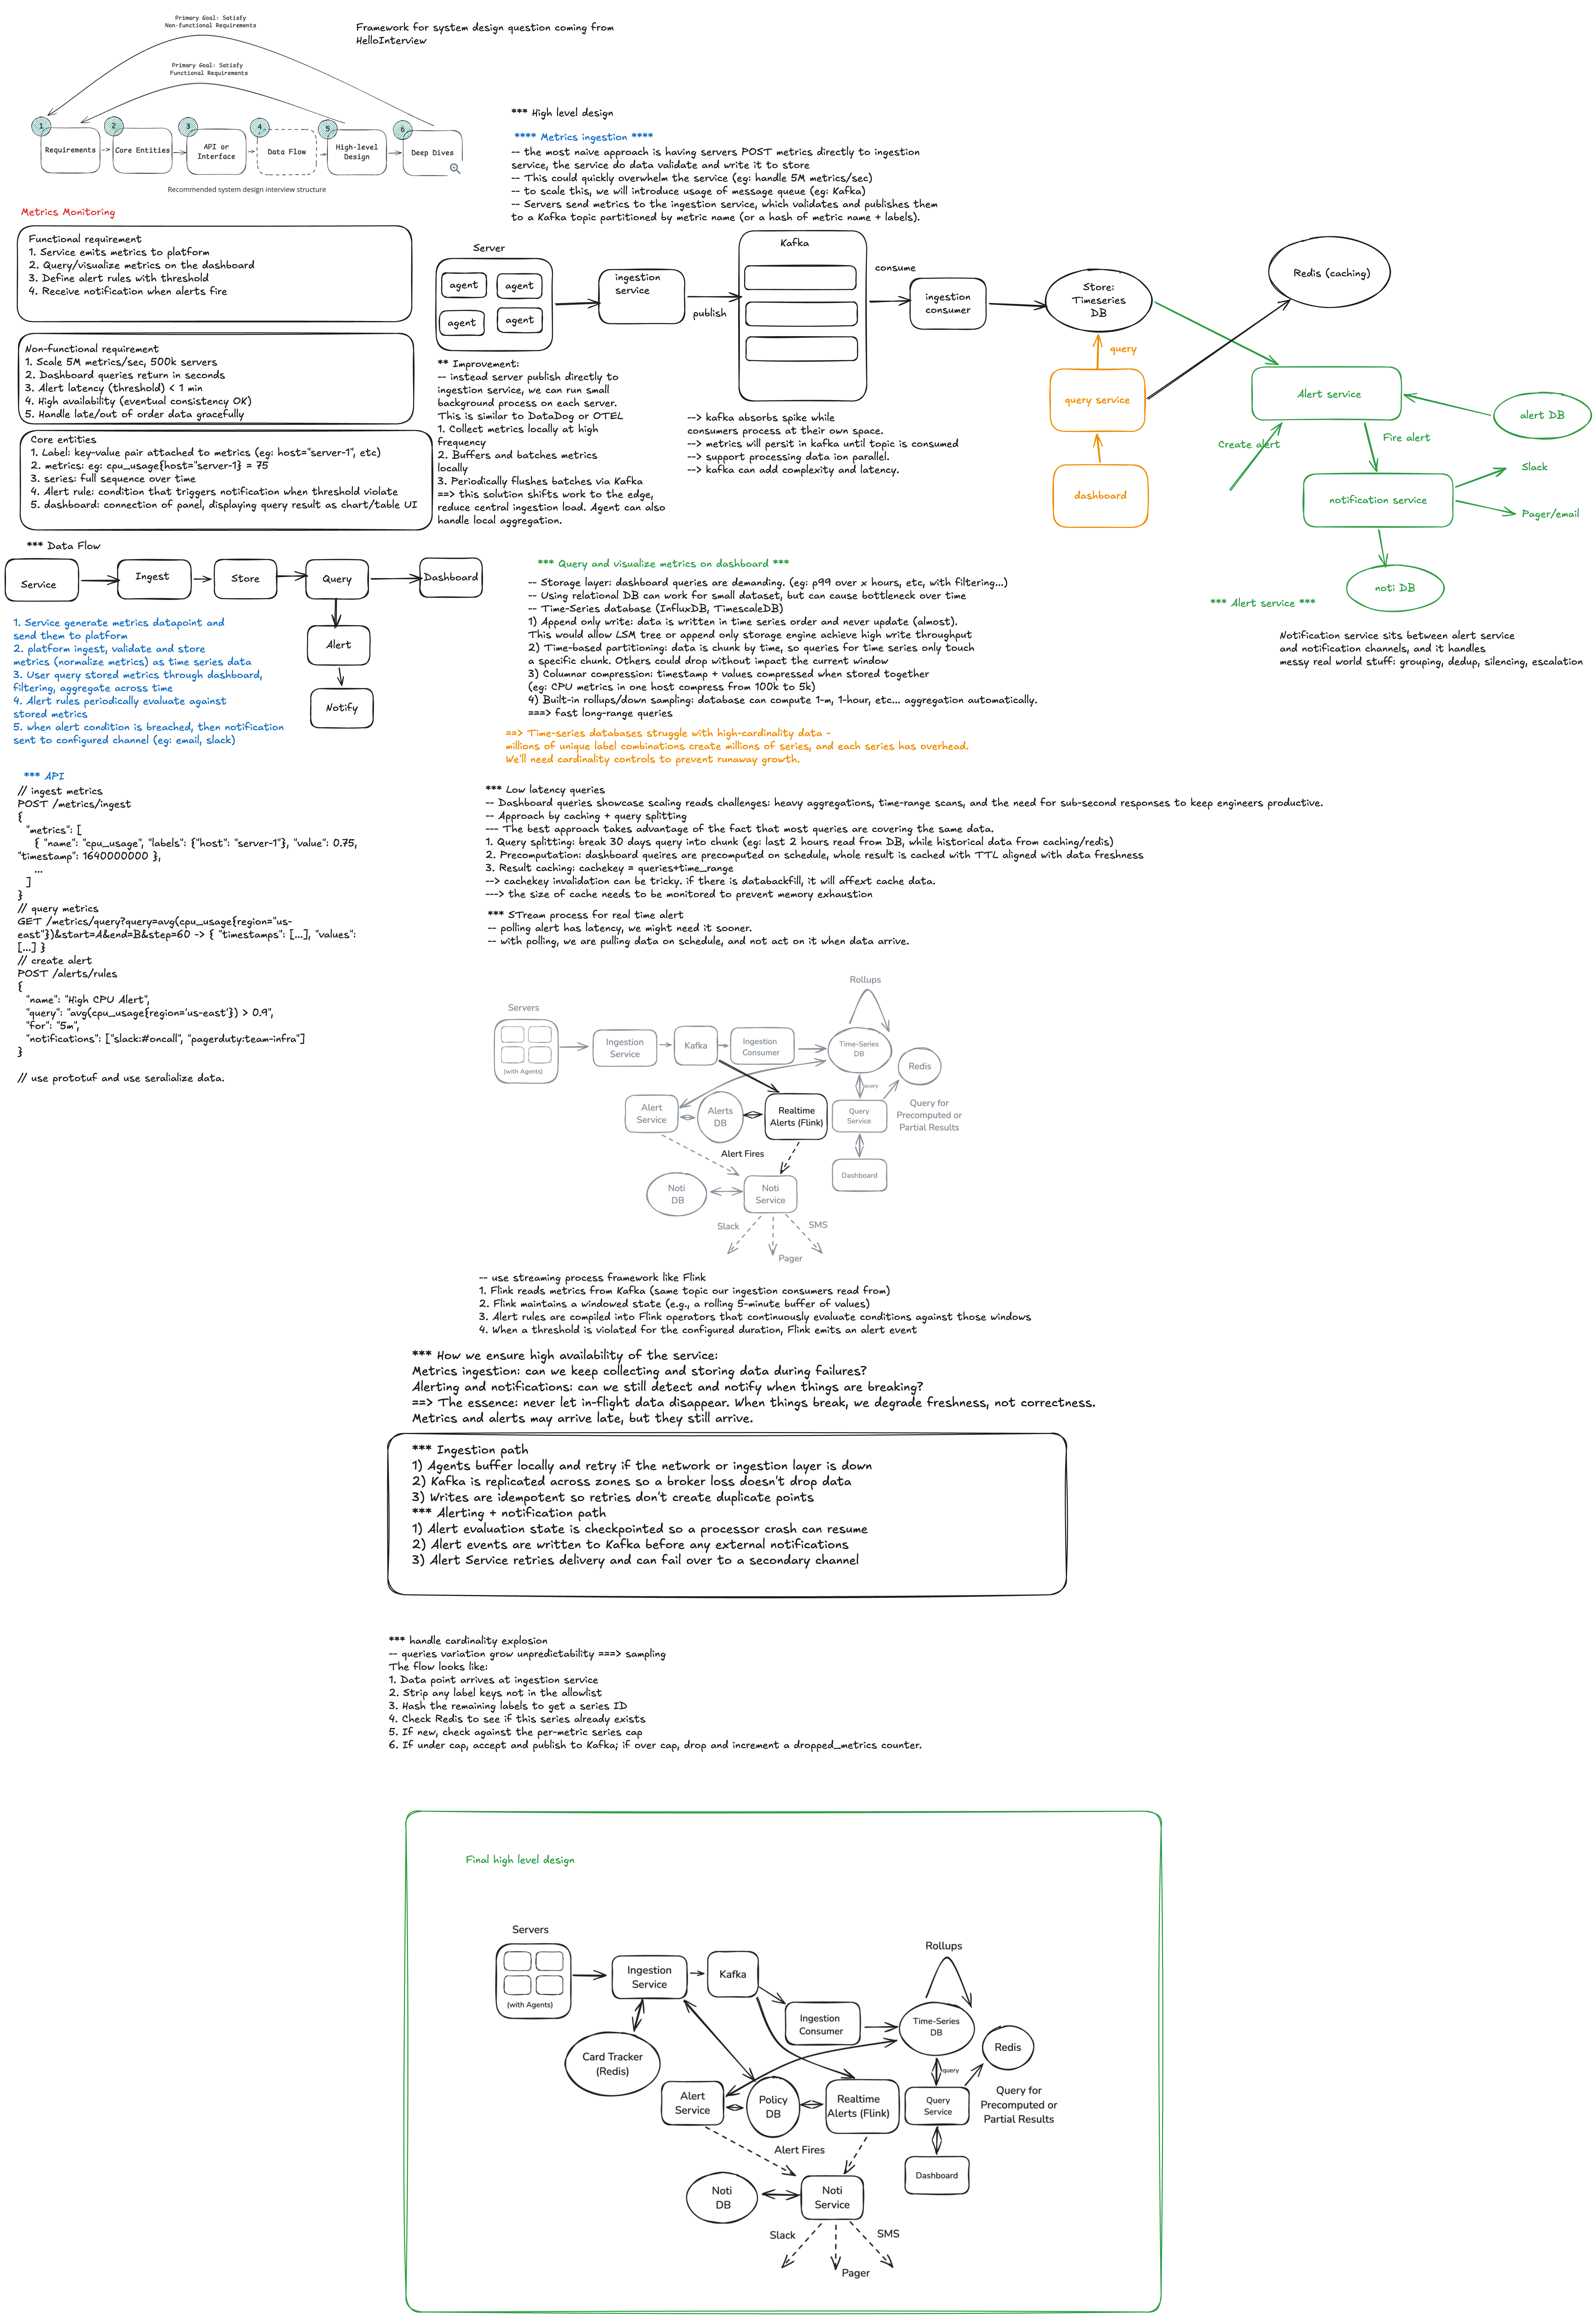
Metrics Monitoring Platform System Design
What Is a Metrics Monitoring Platform?
A metrics monitoring platform collects performance data from servers, containers, databases, queues, and services. It stores the data as time-series metrics, visualizes it on dashboards, and triggers alerts when systems behave abnormally.
Examples:
- Datadog
- Prometheus and Grafana
- AWS CloudWatch
- Google Cloud Monitoring
This is infrastructure engineers rely on to understand system health, debug incidents, and prevent outages.
Problem
Design a platform that can collect metrics such as CPU, memory, request throughput, latency, error rate, queue depth, and custom application counters from many services. Users should be able to query historical metrics, build dashboards, and configure alerts.
Goals
- Collect metrics from many hosts and services.
- Support high write throughput.
- Store metrics efficiently as time-series data.
- Query recent and historical data quickly.
- Display dashboards with charts and aggregations.
- Trigger alerts when thresholds or anomaly conditions are met.
- Support multi-tenant teams and access control.
- Remain reliable during incidents, when metrics volume may spike.
Non-Goals
- Full distributed tracing.
- Full log search platform.
- Incident management product with paging rotations.
- Long-term data warehouse analytics beyond metrics use cases.
Requirements
Functional Requirements
- Agents or SDKs emit metrics from services and machines.
- Metrics include name, timestamp, value, tags, and source.
- Users can query metrics by name, time range, and tags.
- Users can build dashboards with line charts, gauges, tables, and heatmaps.
- Users can define alert rules.
- The system sends alert notifications to email, Slack, PagerDuty, or webhooks.
- The system supports rollups like avg, min, max, p95, p99, sum, and count.
- The system supports retention policies for raw and downsampled data.
Non-Functional Requirements
- High availability for ingestion and alerting.
- Low latency for recent metric queries.
- Durable enough to avoid data loss during short failures.
- Horizontal scalability for high-cardinality workloads.
- Multi-tenant isolation and rate limiting.
- Cost-efficient storage for large volumes of time-series data.
Example Metrics
cpu.usage{host=api-01, region=us-west, env=prod} 78.5
memory.used{host=api-01, region=us-west, env=prod} 12.2GB
http.requests.count{service=checkout, status=200} 1200
http.latency.p95{service=checkout, route=/pay} 240ms
queue.depth{queue=email_jobs} 430
High-Level Architecture
Agents / SDKs / Exporters
  -> Local Buffer
  -> Metrics Ingestion Gateway
  -> Validation + Auth + Rate Limit
  -> Stream / Queue
  -> Aggregation Workers
  -> Time-Series Storage
  -> Query Service
  -> Dashboard Service

Alert Rules
  -> Alert Evaluator
  -> Notification Service
  -> Slack / Email / PagerDuty / Webhook
Core Components
Metrics Agent
Runs on each host, container, or service environment.
Responsibilities:
- Collect system metrics like CPU, memory, disk, and network.
- Scrape local endpoints such as
/metrics. - Accept custom application metrics from SDKs.
- Batch and compress metric points before sending.
- Buffer locally when the network is unavailable.
Staff-level note:
The agent should protect the customer service. If metrics collection is slow or the backend is unavailable, the agent should drop or buffer metrics rather than consume too much CPU, memory, or network.
Metrics Ingestion Gateway
Receives metric batches from agents and SDKs.
Responsibilities:
- Authenticate requests.
- Validate metric format.
- Apply tenant-level rate limits.
- Reject or sample abusive high-cardinality metrics.
- Write accepted metrics to a durable stream.
Design choice:
Keep ingestion stateless so it can scale horizontally behind a load balancer.
Stream / Queue
Buffers metrics between ingestion and storage.
Options:
- Kafka
- Pulsar
- Kinesis
- Pub/Sub
Why it is needed:
- Absorbs ingestion spikes.
- Allows storage workers to scale independently.
- Enables replay for backfill or bug fixes.
- Decouples customer traffic from storage latency.
Aggregation Workers
Consume raw metric events and prepare them for storage.
Responsibilities:
- Group points by metric name, tenant, tags, and time bucket.
- Compute rollups such as sum, count, avg, min, max, p95, and p99.
- Write raw data for short-term retention.
- Write downsampled data for long-term retention.
Example rollups:
10-second raw points retained for 7 days
1-minute rollups retained for 30 days
1-hour rollups retained for 13 months
Time-Series Storage
Stores metric points indexed by time.
Storage requirements:
- Fast writes.
- Efficient time-range scans.
- Compression.
- Retention and downsampling.
- Tag-based filtering.
Possible choices:
- Prometheus TSDB for single-cluster or smaller deployments.
- Mimir, Thanos, or Cortex for scalable Prometheus-compatible storage.
- ClickHouse for high-scale analytical time-series queries.
- Cassandra or DynamoDB style storage for wide-column time-series writes.
- Custom LSM-based time-series storage for specialized scale.
Staff-level tradeoff:
Time-series storage is mostly about balancing write throughput, query latency, compression, and cardinality. The hard problem is not storing one metric; it is storing millions of unique metric/tag combinations efficiently.
Data Model
Metric Point
tenant_id
metric_name
timestamp
value
tags
source
type
Metric types:
- Counter: monotonically increasing value, such as request count.
- Gauge: current value, such as memory usage.
- Histogram: distribution, such as latency buckets.
- Summary: precomputed quantiles.
Series Identity
A time series is uniquely identified by:
tenant_id + metric_name + sorted_tags
Example:
tenant=acme
metric=http.requests.count
tags={service=checkout, region=us-west, status=500}
API Design
Ingest Metrics
POST /api/v1/metrics
{
  "tenantId": "tenant_123",
  "metrics": [
    {
      "name": "http.latency",
      "type": "histogram",
      "timestamp": "2026-06-22T10:00:00Z",
      "value": 240,
      "tags": {
        "service": "checkout",
        "route": "/pay",
        "region": "us-west"
      }
    }
  ]
}
Query Metrics
GET /api/v1/query?metric=http.latency&from=now-1h&to=now&groupBy=service
Example response:
{
  "series": [
    {
      "metric": "http.latency",
      "tags": {
        "service": "checkout"
      },
      "points": [
        ["2026-06-22T10:00:00Z", 240],
        ["2026-06-22T10:01:00Z", 230]
      ]
    }
  ]
}
Create Alert Rule
POST /api/v1/alerts
{
  "name": "Checkout p95 latency too high",
  "query": "p95(http.latency{service=checkout}) > 500",
  "window": "5m",
  "severity": "critical",
  "notify": ["pagerduty", "slack"]
}
Query Path
User opens dashboard
  -> Dashboard Service loads chart configuration
  -> Query Service parses metric query
  -> Query Planner selects raw or downsampled data
  -> Time-Series Store scans relevant series
  -> Query Service aggregates and downsamples result
  -> Dashboard renders chart
Optimizations:
- Use downsampled data for large time ranges.
- Cache common dashboard queries.
- Limit maximum time range and output points.
- Parallelize queries across partitions.
- Precompute expensive aggregations for popular dashboards.
Alerting Design
Alerting should not depend on dashboard users being online.
Alert Rule Store
  -> Scheduler
  -> Alert Evaluator
  -> Query Service
  -> State Machine
  -> Notification Service
Alert states:
- OK
- Pending
- Firing
- Silenced
- Resolved
Important alert features:
- Evaluation window.
- Consecutive failure count.
- Deduplication.
- Suppression and silence windows.
- Notification retries.
- Escalation routing.
Example:
If p95 checkout latency > 500 ms for 5 minutes, page the on-call engineer.
Staff-level point:
Alert quality matters more than alert quantity. The platform should reduce noisy alerts through grouping, deduplication, burn-rate alerts, and clear ownership.
Cardinality
Cardinality is the number of unique time series.
This can explode when tags contain unbounded values:
Bad tags:
user_id
request_id
session_id
full_url_with_query_params
Good tags:
service
region
env
status_code
route_template
host
Mitigations:
- Enforce tag limits.
- Drop or sample high-cardinality metrics.
- Warn users when a metric creates too many series.
- Use allowlists for important dimensions.
- Aggregate at the agent before sending.
Interview note:
Cardinality is one of the most important topics in metrics monitoring design. A platform can fail even with moderate traffic if every request creates a unique time series.
Storage Partitioning
Common partition keys:
- Tenant ID.
- Metric name.
- Time bucket.
- Hash of tag set.
Example:
partition = hash(tenant_id, metric_name, time_bucket)
Why:
- Keeps writes distributed.
- Makes time-range queries efficient.
- Allows tenant-level isolation.
- Supports retention deletion by time bucket.
Retention and Downsampling
Raw metrics are expensive to keep forever.
Example policy:
Raw 10-second data: 7 days
1-minute rollup: 30 days
5-minute rollup: 90 days
1-hour rollup: 13 months
Downsampling reduces storage cost while preserving long-term trends.
Reliability
Failure cases:
- Agent cannot reach backend.
- Ingestion gateway is overloaded.
- Queue lag grows.
- Storage writes fail.
- Query service is slow.
- Alert evaluator cannot query data.
- Notification provider is unavailable.
Mitigations:
- Agent-side buffering with bounded disk usage.
- Stateless ingestion gateways with autoscaling.
- Durable queue with replay.
- Backpressure and rate limits.
- Storage replication.
- Query fallbacks to older rollups.
- Alert evaluator retries and state persistence.
- Notification retry with idempotency keys.
Multi-Tenancy
The platform should isolate tenants by:
- Authentication and authorization.
- Per-tenant ingestion quotas.
- Per-tenant query limits.
- Per-tenant retention policies.
- Per-tenant encryption keys if required.
- Separate noisy tenants through partitioning or dedicated clusters.
Staff-level point:
One noisy tenant should not degrade ingestion, queries, or alerting for other tenants.
Security
Important controls:
- API keys or mTLS for agents.
- RBAC for dashboards and alert rules.
- Audit logs for alert and dashboard changes.
- Encryption in transit and at rest.
- Secret redaction from metric tags.
- Tenant boundary enforcement in every query.
Observability for the Monitoring Platform
The monitoring platform also needs monitoring.
Track:
- Metrics received per second.
- Dropped metric count.
- Queue lag.
- Storage write latency.
- Query p95 and p99 latency.
- Alert evaluation delay.
- Notification success rate.
- Cardinality growth.
- Cost per tenant.
This is sometimes called "monitoring the monitor."
Frontend Dashboard Design
Dashboard features:
- Time range picker.
- Auto-refresh.
- Chart panels.
- Query editor.
- Template variables.
- Service and environment filters.
- Alert annotations on charts.
- Shareable dashboard URLs.
Frontend performance concerns:
- Avoid rendering too many points.
- Downsample chart data on the backend.
- Virtualize long dashboard lists.
- Cache dashboard configuration.
- Show partial results when one panel fails.
Scale Estimate
Example:
- 100,000 hosts.
- Each host emits 1,000 metric points per minute.
- Total: 100 million points per minute.
- About 1.67 million points per second.
Implications:
- Ingestion must batch heavily.
- Storage must compress time-series data.
- Queries must use rollups and partition pruning.
- Cardinality controls are required.
Tradeoffs
Push vs Pull Collection
Push:
- Agents send metrics to the backend.
- Works well across private networks and cloud environments.
- Needs authentication and backpressure controls.
Pull:
- Backend scrapes targets.
- Easier for service discovery in some environments.
- Harder across firewalls and customer networks.
Recommended:
Support both patterns when building a general platform. Prometheus-style pull works well inside clusters; agent push works well for SaaS monitoring.
Raw Data vs Rollups
Raw data:
- Better debugging precision.
- Higher cost.
Rollups:
- Cheaper and faster for long ranges.
- Loses detail.
Recommended:
Keep raw data short-term and downsampled data long-term.
Threshold Alerts vs Anomaly Detection
Threshold alerts:
- Easy to understand.
- Can be noisy.
Anomaly detection:
- More adaptive.
- Harder to explain.
Recommended:
Start with clear threshold and burn-rate alerts. Add anomaly detection for mature teams with enough historical data.
Staff-Level Interview Points
- Metrics are high-write, time-series workloads.
- Cardinality control is a first-class design concern.
- Ingestion should be decoupled from storage through a durable queue.
- Alerting must be reliable and independent from dashboards.
- Query performance depends on rollups, partitioning, caching, and downsampling.
- The agent must protect customer workloads.
- Multi-tenancy needs quotas and isolation.
- The platform should prioritize actionable alerts over noisy alerts.
- Monitoring systems need their own monitoring and SLOs.
Interview Summary
At a high level, design the system around five flows:
- Agents collect and batch metrics.
- Ingestion gateways validate, rate limit, and enqueue data.
- Workers aggregate and store time-series points.
- Query services power dashboards and APIs.
- Alert evaluators continuously query metrics and notify owners.
The strongest staff-level answer discusses not only the happy path, but also cardinality, noisy tenants, alert fatigue, retention cost, query performance, and how the monitoring platform behaves during an actual production incident.