Editable diagram: Open in Excalidraw
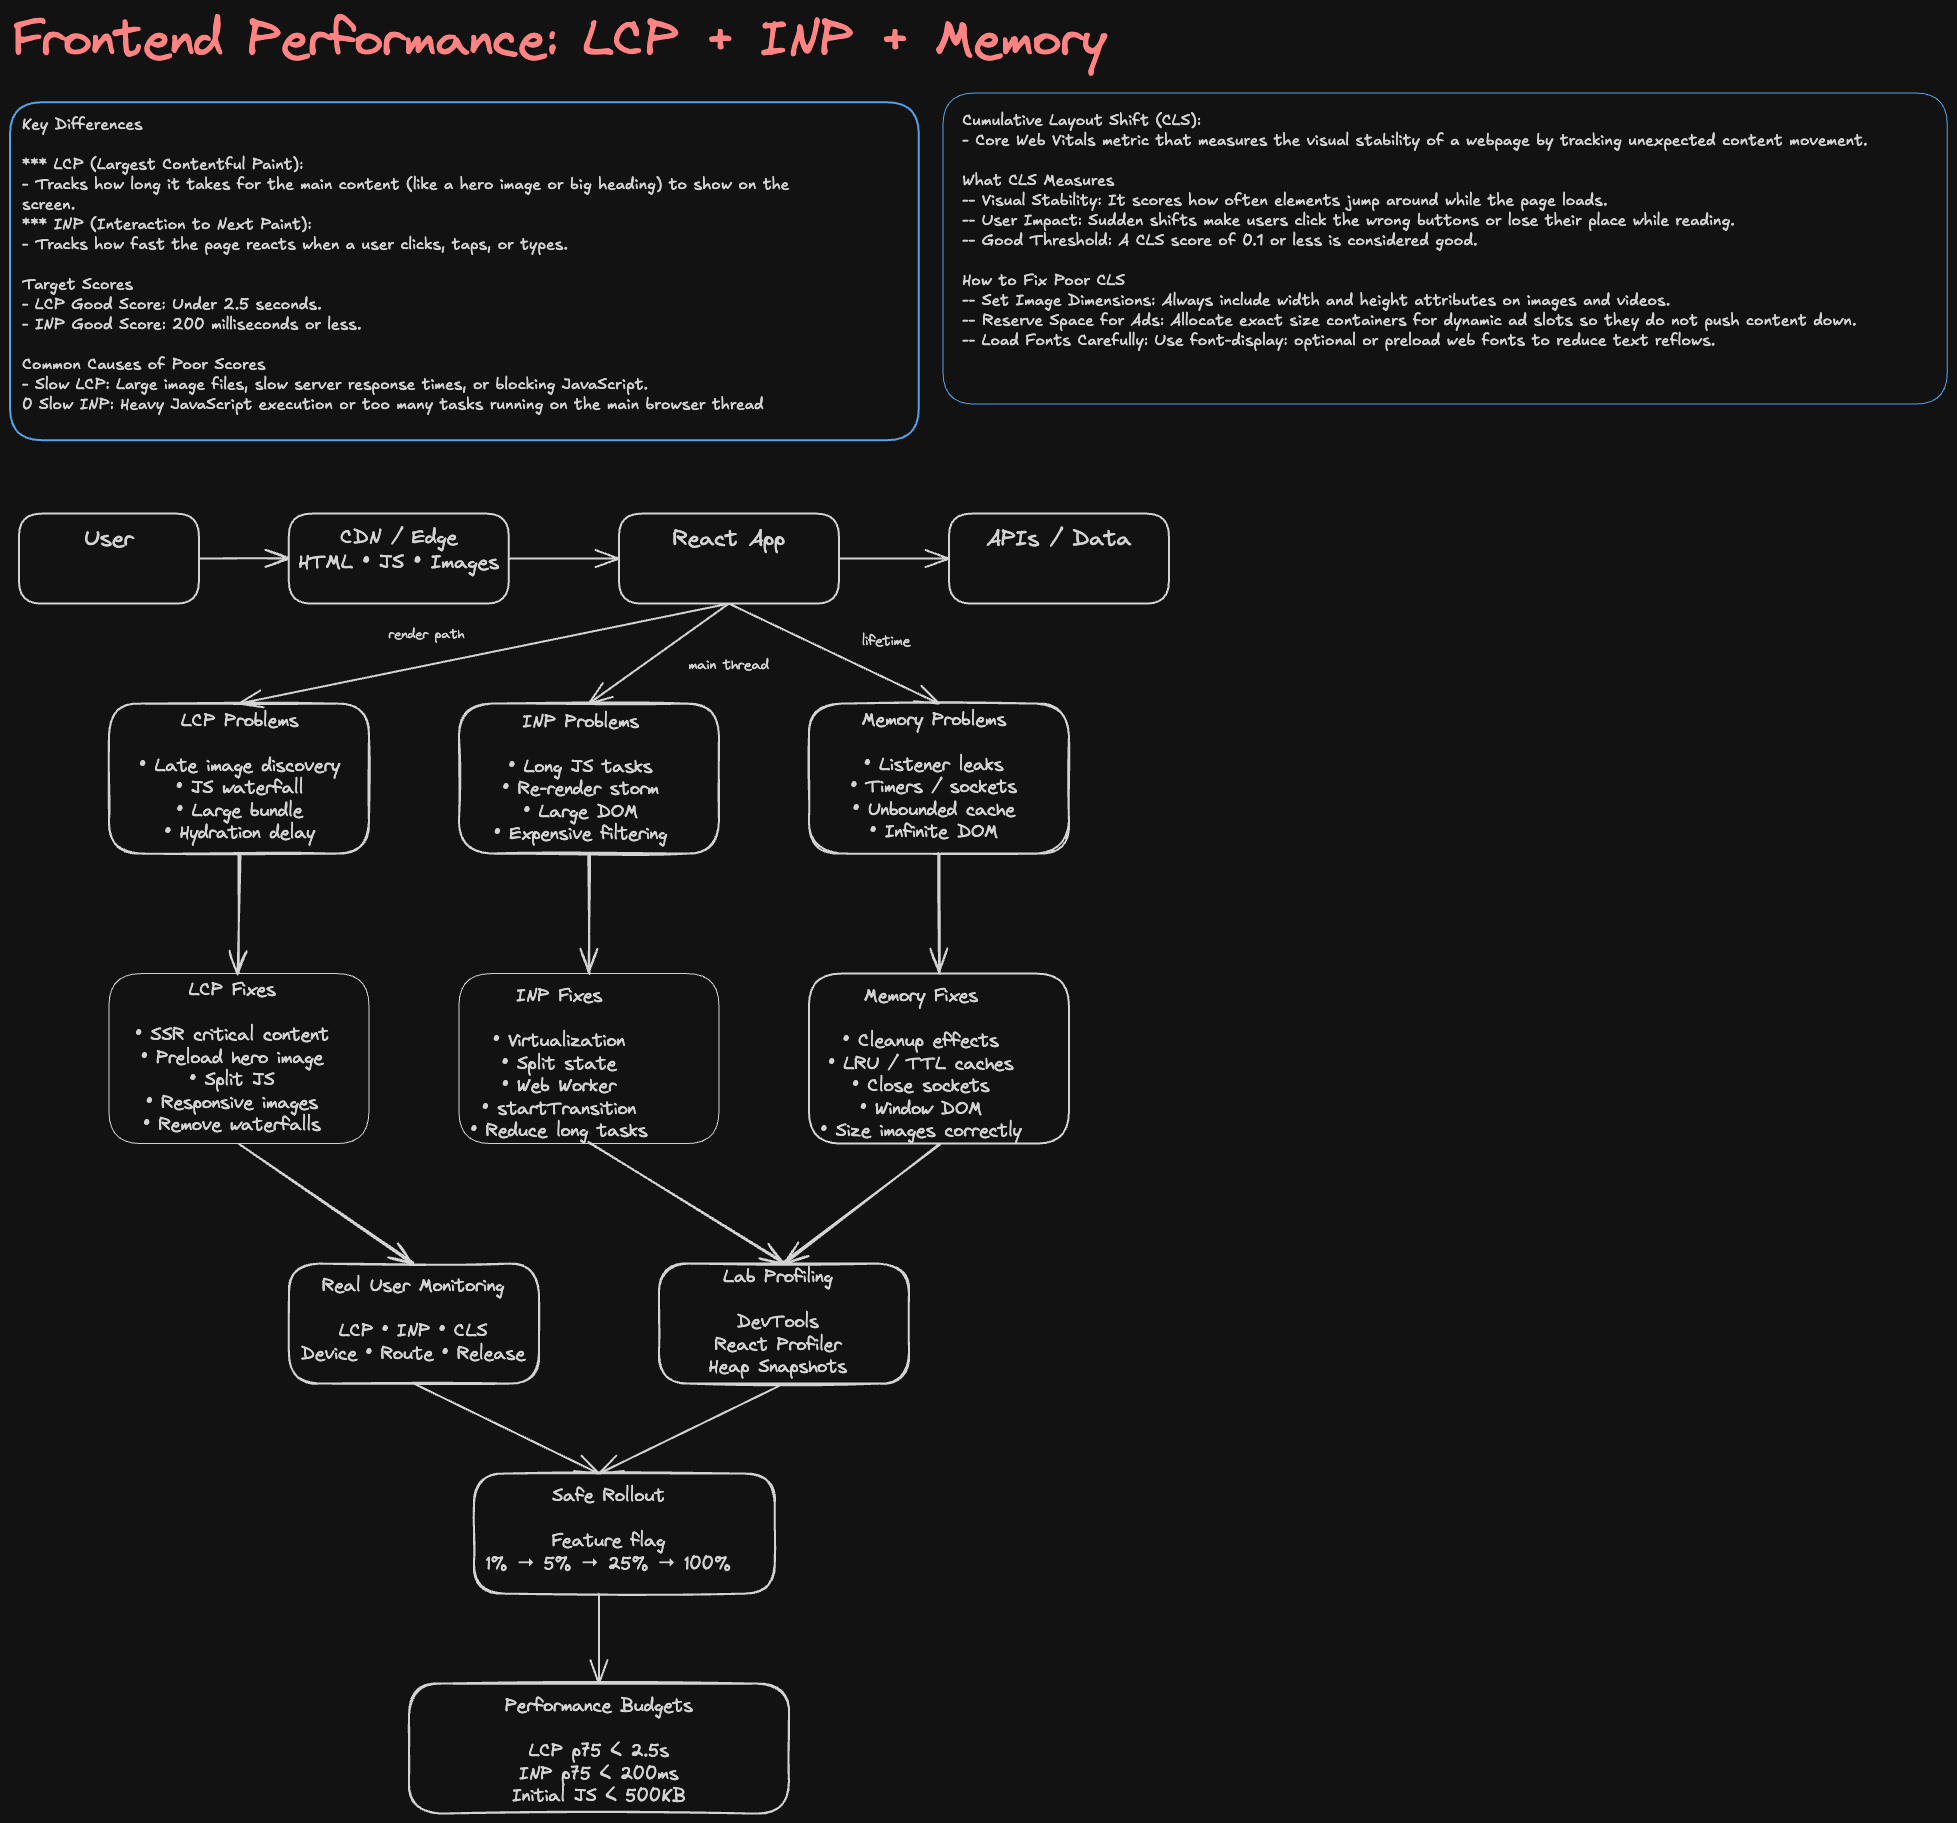
Improve Poor LCP, INP, and Memory Usage
Interview Prompt
A page has poor Core Web Vitals and users report sluggish interactions after using the page for a while.
Current symptoms:
- LCP is ~5 seconds
- INP is consistently above 400 ms
- Memory usage grows over time
- Scrolling becomes janky after prolonged usage
Design an approach to diagnose and improve the frontend.
1. How I Would Start the Interview
I would avoid jumping immediately into optimization.
First, I would clarify:
Product Context
- Which surface is affected?
- Discover / Home?
- Marketplace?
- Creator dashboard?
- Game detail page?
- Desktop web only or mobile web too?
- Logged-in only or public page?
- Is SEO important?
- Does the page contain:
- large image grids?
- infinite scrolling?
- real-time updates?
- video?
- heavy analytics?
- What are current performance targets?
Performance Targets
Example goals:
| Metric | Current | Target |
|---|---|---|
| LCP | 5.0s | < 2.5s |
| INP | 450ms | < 200ms |
| CLS | 0.18 | < 0.1 |
| JS bundle | 1.8MB | < 500KB initial |
| Memory | +200MB / 20 min | stable |
I would explicitly separate the problem into:
1. Measure
2. Identify bottleneck
3. Fix highest-impact bottleneck
4. Validate
5. Prevent regression
2. High-Level Architecture
                          +----------------------+
                          |     User Browser     |
                          +----------+-----------+
                                     |
                                     v
                          +----------------------+
                          |      CDN / Edge      |
                          | HTML / JS / Images   |
                          +----------+-----------+
                                     |
                                     v
                          +----------------------+
                          |      React App       |
                          +----------------------+
                            |        |        |
                            |        |        |
                         Render    Data     Events
                            |        |        |
                            v        v        v
                         DOM     API Cache   Handlers
                            |        |        |
                            +----+---+---+----+
                                 |
                                 v
                          Performance Metrics
                                 |
                    +------------+-------------+
                    |                          |
                    v                          v
                 RUM / Logs               DevTools
             Core Web Vitals          Profiling / Traces
The important interview point is:
I would distinguish network/rendering problems, main-thread execution problems, and lifetime/resource-management problems because LCP, INP, and memory usually have different root causes.
3. LCP: Largest Contentful Paint
What LCP Measures
LCP measures when the largest visible content element in the initial viewport finishes rendering.
For a -style page, the LCP element might be:
- hero image
- game thumbnail
- recommendation carousel
- banner
- large title/content block
Possible LCP Bottlenecks
Navigation
   |
   v
Slow HTML
   |
   v
Large JS bundle
   |
   v
JS parse / execute
   |
   v
React hydration
   |
   v
API request
   |
   v
Image request
   |
   v
LCP rendered
Common causes:
1. Large JavaScript Bundle
Bad:
HTML
 |
 +--> download 2 MB JS
 |
 +--> parse
 |
 +--> execute
 |
 +--> render content
Fix:
- route-level code splitting
- component lazy loading
- remove unused dependencies
- tree shaking
- avoid loading analytics synchronously
- delay noncritical features
Example:
const Recommendations = React.lazy(() => import('./Recommendations'));
2. Client-Side Data Waterfall
Bad:
HTML
  |
  v
JS
  |
  v
React mount
  |
  v
/profile
  |
  v
/recommendations
  |
  v
/images
This creates sequential latency.
Better:
               +--> profile
HTML / SSR ----+--> recommendations
               +--> image preload
Use:
- SSR or server rendering for critical content
- parallel requests
- preload
- streaming
- server-side aggregation where appropriate
3. Poor Image Loading
Game thumbnails can dominate LCP.
Use:
<img src={game.image} width={320} height={180} fetchPriority="high" decoding="async" alt="" />
For the LCP image:
- do not lazy load
- use
fetchpriority="high" - preload if known
- serve responsive sizes
- use CDN
- modern image format
- avoid massive source image
For images below fold:
<img loading="lazy" ... />
4. Render-Blocking CSS
Potential fixes:
- inline critical CSS
- defer noncritical styles
- reduce global CSS
- remove unused CSS
- split route-specific styles
5. Hydration Cost
If server HTML exists but React takes too long to become interactive:
HTML visible
   |
   +----- huge hydration task ------+
                                    |
                              page interactive
Possible approaches:
- partial hydration
- lazy hydration
- islands-style rendering
- defer noninteractive components
- smaller component tree
- server components where stack allows it
4. INP: Interaction to Next Paint
What INP Measures
INP measures interaction responsiveness.
Examples:
- clicking a game card
- opening a dropdown
- typing in search
- changing filters
- opening a modal
- scrolling + clicking during updates
A poor INP usually means the browser's main thread is busy.
5. Main Thread Model
Main Thread

| JS task: 180ms |
                  | React render: 160ms |
                                        | layout: 80ms |
                                                       | paint |

User Click
   |
   +-------------------------------------------> response
The interaction cannot run until the main thread becomes available.
6. Causes of Poor INP
Cause 1: Long JavaScript Tasks
Example:
function handleFilter(items, query) {
  return items.filter(expensiveFilter).sort(expensiveSort).map(expensiveTransformation);
}
If this processes 20,000 items on every keystroke, INP suffers.
Better:
- debounce
- memoize
- server filtering
- pagination
- Web Worker for CPU-heavy processing
Cause 2: React Re-render Explosion
Example component tree:
<App>
   |
   +-- ContextProvider  <-- changing value
        |
        +-- Header
        +-- Sidebar
        +-- Search
        +-- 500 GameCards
A context update can accidentally re-render the entire page.
Fix:
Split state ownership

SearchState
   |
   +--> SearchInput
   +--> SearchResults

PresenceState
   |
   +--> FriendsPanel
Strategies:
- colocate state
- split contexts
- selectors
React.memo- stable callbacks
- memoize expensive derived state
- avoid storing unrelated global state together
7. Example React Optimization
Before:
function GameGrid({ games, selectedId }) {
  return games.map((game) => <GameCard game={game} selected={selectedId === game.id} />);
}
Every selected item change potentially re-renders all cards.
Improvement:
const GameCard = React.memo(function GameCard({ game, selected, onSelect }) {
  return <button onClick={() => onSelect(game.id)}>{game.name}</button>;
});
But in an interview I would say:
I would profile before adding memoization.
React.memoitself adds complexity and comparison overhead.
8. Virtualization
If Discover renders thousands of games:
Bad:
5000 games
=
5000 card components
=
5000 DOM nodes+
Better:
5000 data items

Visible viewport:
------------------
Game 101
Game 102
Game 103
Game 104
Game 105
------------------

Only ~10-30 rows rendered
Use windowing / virtualization.
Benefits:
- less DOM
- less React work
- lower memory
- faster layout
- smoother scrolling
9. Scheduling Work
For noncritical work:
requestIdleCallback(() => {
  processAnalytics();
});
or:
requestAnimationFrame(() => {
  updateVisualState();
});
React concepts:
startTransition(() => {
  setSearchResults(results);
});
Critical input:
typing
   |
   +--> update input immediately
   |
   +--> lower priority result rendering
This keeps the UI responsive.
10. Memory Usage
This is a different problem from LCP and INP.
Symptoms:
Initial page: 100 MB

5 min:   140 MB
10 min:  220 MB
20 min:  430 MB
The important question:
Does memory eventually stabilize, or does retained memory continuously increase?
11. Common React Memory Leaks
Event Listener Leak
Bad:
useEffect(() => {
  window.addEventListener('resize', handleResize);
}, []);
Missing cleanup.
Correct:
useEffect(() => {
  window.addEventListener('resize', handleResize);

  return () => {
    window.removeEventListener('resize', handleResize);
  };
}, []);
Timer Leak
Bad:
useEffect(() => {
  setInterval(refreshData, 5000);
}, []);
Correct:
useEffect(() => {
  const timer = setInterval(refreshData, 5000);

  return () => clearInterval(timer);
}, []);
WebSocket Leak
Bad:
useEffect(() => {
  const socket = new WebSocket(url);

  socket.onmessage = handleMessage;
}, []);
Correct:
useEffect(() => {
  const socket = new WebSocket(url);

  socket.onmessage = handleMessage;

  return () => {
    socket.close();
  };
}, []);
12. Unbounded Cache Growth
This is especially relevant for a -style app.
Suppose:
User visits game 1
User visits game 2
User visits game 3
...
User visits game 10,000
If every result stays cached forever:
cache.set(gameId, game);
memory grows indefinitely.
Better:
LRU cache

max entries = N

new entry
   |
   v
cache full?
   |
   +-- yes --> evict least recently used
Other strategies:
- TTL expiration
- max entries
- cache by page
- garbage collection
- normalized entities
- query-cache expiration
13. Infinite Scroll Memory
A common trap:
Page 1
Page 2
Page 3
...
Page 200
Even with lazy loading, keeping every DOM node defeats the purpose.
Use:
Infinite pagination + virtualization
not merely:
Infinite pagination
14. Image Memory
Large decoded images consume significantly more memory than compressed file size.
Example:
Image:
2000 x 2000

RGBA decoded memory:
2000 × 2000 × 4
≈ 16 MB
20 large images could consume hundreds of MB.
Fix:
- request correct image dimensions
- responsive images
- thumbnails rather than original assets
- unload offscreen media when appropriate
- CDN resizing
15. Data Fetching
I would separate:
Initial critical data
vs
Below-fold data
vs
Realtime data
Example:
Initial request

GET /discover

returns:
- first recommendation section
- hero
- essential user state
Then:
scroll
  |
  v
GET /discover?cursor=...
Friends/presence can use a separate real-time channel.
16. Avoiding Request Races
Example search:
Request A: "ro"
Request B: "rob"
Request C: ""

Response C arrives
Response A arrives later
Without cancellation, A could overwrite C.
Use:
useEffect(() => {
  const controller = new AbortController();

  fetch(`/search?q=${query}`, {
    signal: controller.signal,
  });

  return () => controller.abort();
}, [query]);
This improves correctness and avoids wasted work.
17. Performance Measurement
I would use two complementary approaches.
Lab Measurement
Developer environment:
- Chrome DevTools
- Performance profiler
- React Profiler
- Memory heap snapshots
- Lighthouse
- network throttling
- CPU throttling
Useful for finding root cause.
18. Real User Monitoring
Lab tests are not enough.
Collect:
LCP
INP
CLS
TTFB
JS errors
route
device
browser
network class
release/version
Example event:
{
  "metric": "INP",
  "value": 420,
  "route": "/discover",
  "device": "mobile",
  "release": "2026.09.16"
}
Then segment:
p50
p75
p95
by:
- page
- browser
- device
- geographic region
- release version
19. Debugging LCP
Use DevTools to answer:
What is the LCP element?
       |
       v
Why was it delayed?
Breakdown:
TTFB
+
resource discovery delay
+
resource download
+
element render delay
=
LCP
Then optimize whichever portion dominates.
20. Debugging INP
Record a performance trace.
Look for:
User interaction
     |
     v
Long task
     |
     +--> JavaScript
     +--> React rendering
     +--> style calculation
     +--> layout
     +--> paint
Then inspect React Profiler:
Which components rendered?
Why did they render?
How long did each render take?
21. Debugging Memory
Workflow:
1. Load page
2. Heap snapshot A
3. Perform workflow 20x
4. Trigger GC
5. Heap snapshot B
6. Compare retained objects
Look for:
- detached DOM nodes
- retained component closures
- event listeners
- timers
- WebSocket handlers
- large arrays
- unbounded Maps/Sets
- image objects
- application caches
22. Architecture After Optimization
                         Browser
                            |
            +---------------+----------------+
            |                                |
            v                                v
      Critical Route                    Lazy Features
            |                                |
            v                                v
       Small JS Bundle                  Code Split Chunks
            |
            +------------+
            |            |
            v            v
        SSR Data      Image CDN
            |            |
            v            v
      Initial Render  Optimized Images
            |
            v
       React Hydration
            |
      +-----+------+
      |            |
      v            v
Input/UI      Async Rendering
Priority       / Worker
      |
      v
Virtualized UI
      |
      v
Bounded Client Cache
      |
      v
RUM / Core Web Vitals
23. Prioritization
If all three metrics are bad, I would not fix everything simultaneously.
I would rank fixes based on user impact and trace evidence.
Example:
Phase 1 — LCP
- Optimize LCP image.
- Remove render-blocking request waterfall.
- Reduce initial JavaScript.
- SSR critical content.
Phase 2 — INP
- Identify long tasks.
- Reduce unnecessary renders.
- Virtualize long lists.
- Move expensive computations off main thread.
- Schedule noncritical work.
Phase 3 — Memory
- Profile heap.
- Fix subscriptions/listeners/timers.
- Bound caches.
- Virtualize infinite lists.
- resize/unload large media.
24. Rollout Strategy
Staff-level answer:
I would avoid releasing a large optimization rewrite to 100% of users.
New implementation
       |
       v
Feature flag
       |
       +--> 1%
       +--> 5%
       +--> 25%
       +--> 50%
       +--> 100%
Compare:
control vs treatment

LCP
INP
error rate
memory
conversion
engagement
This protects against performance improvements that accidentally hurt product metrics.
25. Performance Budgets
Prevent regression with CI.
Example:
Initial JS < 500 KB
LCP p75 < 2.5s
INP p75 < 200ms
CLS < 0.1
No route chunk > 250 KB
CI can reject significant bundle regressions.
26. Frontend Observability
I would instrument:
                Frontend
                   |
          +--------+--------+
          |        |        |
          v        v        v
        RUM      Errors   Traces
          |        |        |
          +--------+--------+
                   |
                   v
               Dashboard
                   |
          +--------+---------+
          |                  |
          v                  v
      Release View       Route View
Questions we should be able to answer:
- Which release caused LCP regression?
- Which routes have poor INP?
- Which devices are most affected?
- Did memory increase after a feature launch?
- Is the issue limited to a browser version?
27. Testing Strategy
Unit
Test:
- expensive transformation logic
- cache eviction logic
- utility functions
Component
Test:
- loading states
- error states
- pagination
- virtualized rendering behavior
Integration
Test:
- data fetching
- route transitions
- stale cache behavior
- retries
Performance
Automated:
Lighthouse CI
bundle size checks
render benchmarks
Core Web Vital thresholds
28. Staff-Level Tradeoffs
SSR vs CSR
SSR improves:
- initial content
- LCP
- SEO
But adds:
- server complexity
- hydration cost
- infrastructure cost
I would SSR only content that benefits from it.
Memoization
Useful when:
expensive render
+
same props frequently
Avoid blindly memoizing every component.
Web Worker
Use for CPU-intensive work such as:
- large data transforms
- parsing
- sorting
- analytics processing
Do not use for ordinary simple React rendering.
Virtualization
Excellent for huge lists.
Tradeoffs:
- accessibility complexity
- scroll restoration
- dynamic row heights
- focus management
29. Example Interview Walkthrough
If the interviewer says:
The Discover page has LCP = 5 seconds and clicking filters freezes the UI.
I would answer:
Step 1
Measure production RUM to identify affected devices/routes.
Step 2
Use DevTools to identify the LCP element.
Suppose it is a hero game image.
I find:
HTML               300ms
JS download         900ms
JS execution        700ms
API request         800ms
image download     1500ms
The image is discovered very late.
Step 3
Change architecture:
Server knows hero
      |
      +--> render hero HTML
      |
      +--> preload image
And:
<link rel="preload" as="image" href="/hero.webp" />
This removes the JS/API waterfall from the hero image request.
Step 4
For poor INP, profiler shows:
Filter click
  |
  v
12,000 games sorted
  |
  v
12,000 React cards rendered
Change to:
server filtering
+
virtualized results
+
transition
Step 5
Memory profile shows the application retains every loaded page.
Replace:
unbounded cache
with:
TTL + max-size / LRU
and window the DOM.
30. Strong Closing Answer
I would summarize with:
I would treat LCP, INP, and memory as related but separate signals. For LCP, I would optimize the critical rendering and network path. For INP, I would reduce main-thread work and React render cost. For memory, I would look for retained objects, unbounded caches, and long-lived resources. I would validate each change with both lab profiling and real-user metrics, roll it out behind a feature flag, and add performance budgets so we do not regress.
31. Follow-Up Questions to Practice
LCP
- What if the LCP image URL is only known after an API request?
- SSR or preload?
- What if CDN latency is high?
- What if LCP improves but TTI gets worse?
INP
- What if
React.memodoes not improve performance? - When do you use Web Workers?
- How do you identify a long task?
- What if scrolling is still janky after virtualization?
Memory
- How do you identify a detached DOM node?
- How do you distinguish a memory leak from normal caching?
- How do you implement an LRU cache?
- What happens to WebSocket handlers when components unmount?
Architecture
- How would this work with millions of users?
- How do you prevent one team from introducing a bundle regression?
- How do you monitor performance by release?
- How do you gradually roll out an optimization?