AI Observability Study plan
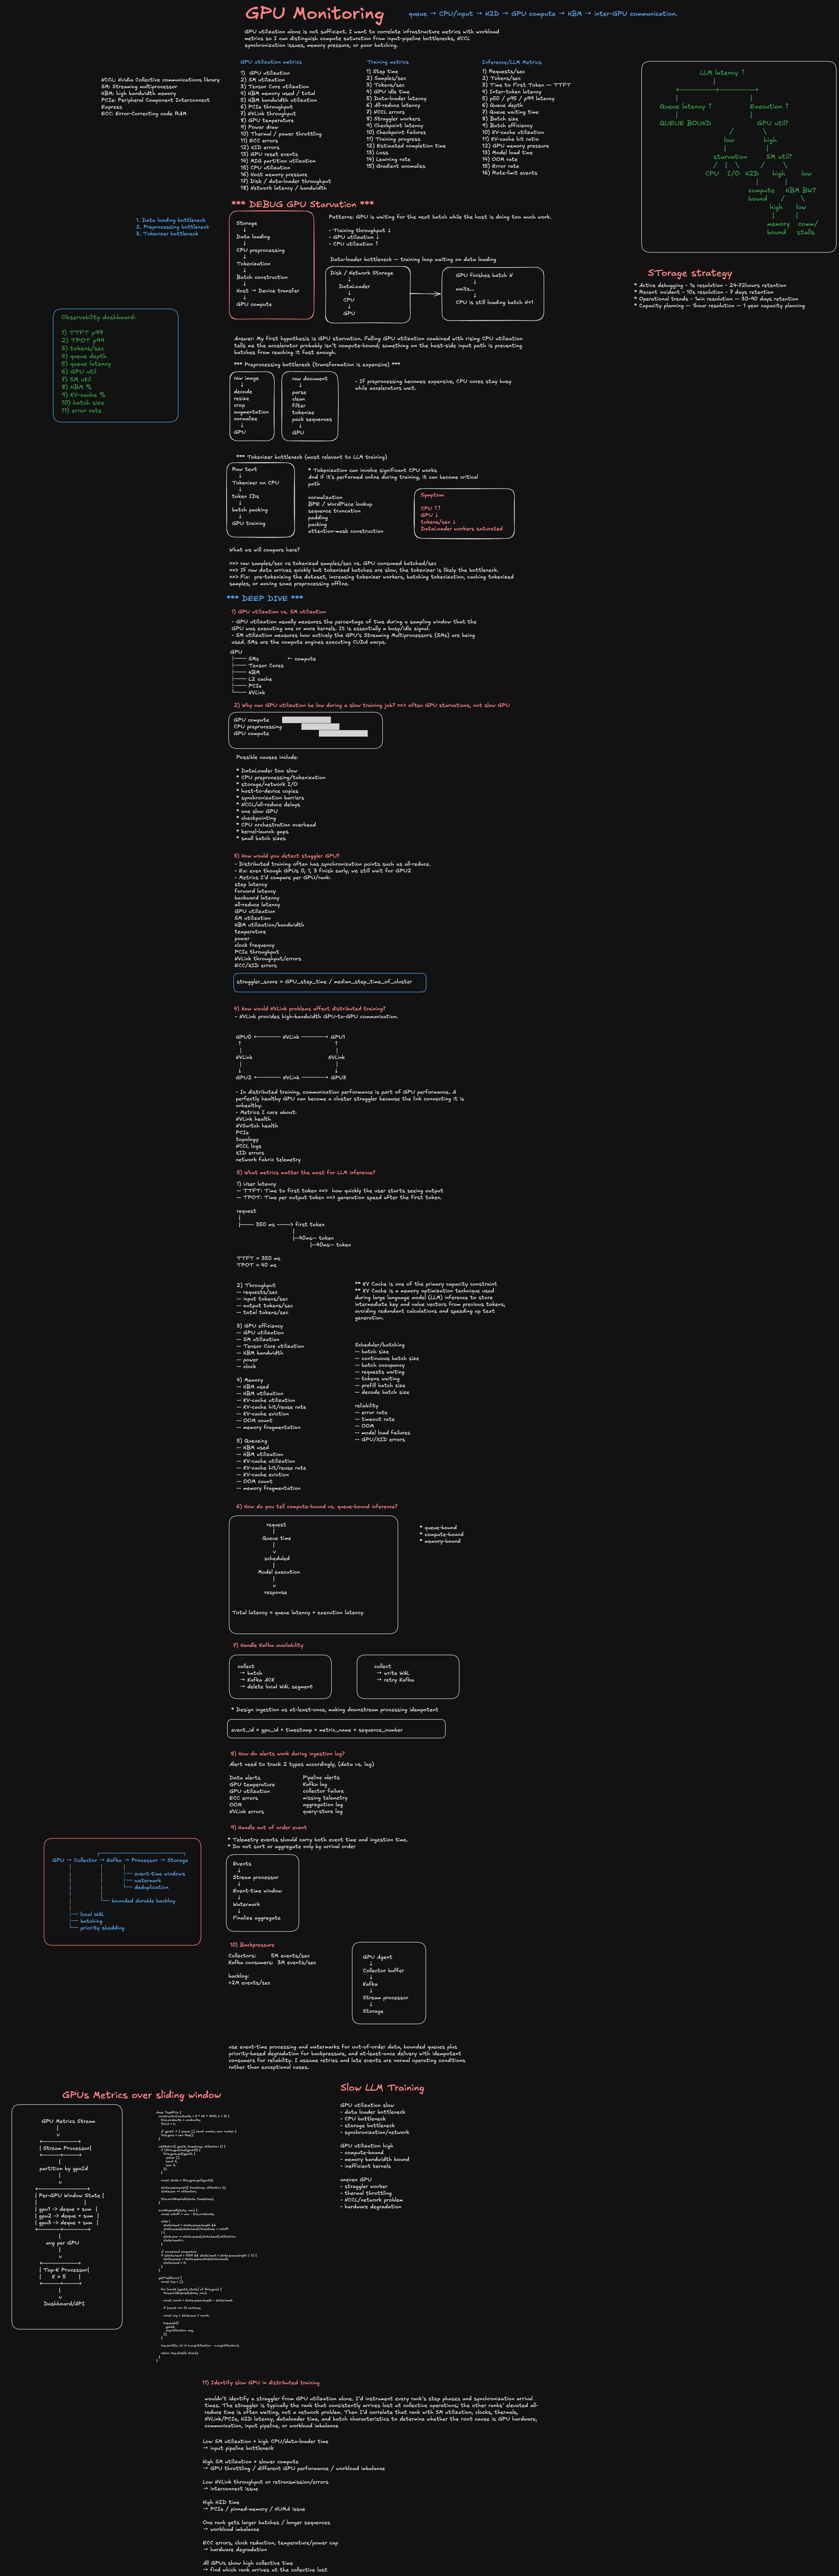
How to Use This Plan
- Treat each day as a focused interview block.
- Check items off as you complete them.
- For every system-design exercise, practice speaking out loud for 35–45 minutes.
- For coding, implement without autocomplete first, then review edge cases and complexity.
- For behavioral questions, prepare concise STAR stories with measurable impact.
Overall Progress
- Day 1 — GPU + AI Observability Fundamentals
- Day 2 — Telemetry System Design
- Day 3 — Backend / API / Data Architecture
- Day 4 — Frontend Observability Dashboard
- Day 5 — Coding + Data Processing
- Day 6 — AI Workload Debugging + LLM Observability
- Day 7 — Full Mock Onsite
Interview Focus Areas
| Area | Target Weight | What we May Look For |
|---|---|---|
| GPU + AI Observability | 30% | Understanding GPU health, training/inference metrics, workload correlation |
| Distributed System Design | 25% | High-volume ingestion, storage, retention, aggregation, reliability |
| Coding | 20% | Clean code, streaming aggregation, DS&A, concurrency, edge cases |
| Frontend Architecture | 15% | Real-time dashboards, performance, caching, visualization, a11y |
| Behavioral / Leadership | 10% | Ownership, cross-team influence, ambiguity, architecture decisions |
Day 1 — GPU + AI Observability Fundamentals
Objective
Be able to answer:
What would you monitor for an GPU cluster running multiple AI workloads?
1. GPU / Infrastructure Metrics
Study and explain what each metric tells you.
- GPU utilization
- SM utilization
- Tensor Core utilization
- HBM memory used / total
- HBM bandwidth utilization
- PCIe throughput
- NVLink throughput
- GPU temperature
- Power draw
- Thermal / power throttling
- ECC errors
- XID errors
- GPU reset events
- MIG partition utilization
- CPU utilization
- Host memory pressure
- Disk / data-loader throughput
- Network latency / bandwidth
Strong Interview Framing
Do not stop at:
“I monitor GPU utilization.”
Instead explain correlation:
GPU utilization alone is not sufficient. I want to correlate infrastructure metrics with workload metrics so I can distinguish compute saturation from input-pipeline bottlenecks, NCCL synchronization issues, memory pressure, or poor batching.
2. Training Metrics
- Step time
- Samples/sec
- Tokens/sec
- GPU idle time
- Data-loader latency
- All-reduce latency
- NCCL errors
- Straggler workers
- Checkpoint latency
- Checkpoint failures
- Training progress
- Estimated completion time
- Loss
- Learning rate
- Gradient anomalies
Diagnostic Exercise
Explain possible causes of:
Training throughput ↓
GPU utilization ↓
CPU utilization ↑
Your answer should include:
- data-loader bottleneck
- preprocessing bottleneck
- tokenizer bottleneck
- host-to-device transfer bottleneck
3. Inference / LLM Metrics
- Requests/sec
- Tokens/sec
- Time to First Token — TTFT
- Inter-token latency
- p50 / p95 / p99 latency
- Queue depth
- Queue waiting time
- Batch size
- Batch efficiency
- KV-cache utilization
- KV-cache hit ratio
- GPU memory pressure
- Model load time
- OOM rate
- Error rate
- Rate-limit events
Day 1 Practice Questions
- What is the difference between GPU utilization and SM utilization?
- Why can GPU utilization be low during a slow training job?
- How would you detect a straggler GPU?
- How would NVLink problems affect distributed training?
- What metrics matter most for LLM inference?
- How do you tell whether inference is compute-bound or queue-bound?
End-of-Day Score
| Topic | Score 1–5 |
|---|---|
| GPU metrics | |
| Training metrics | |
| Inference metrics | |
| Diagnostic reasoning |
Day 2 — Distributed GPU Telemetry System Design
Core Prompt
Design a GPU Telemetry Collection and Analytics Platform for tens of thousands of GPU nodes. Metrics normally arrive every 30 seconds, but debugging mode requires 1-second resolution. Users need real-time dashboards, 3-month trends, alerts, and per-GPU drilldown.
1. Clarify Requirements
Functional
- Collect GPU metrics
- Support 30-second normal sampling
- Support 1-second debugging mode
- Cluster-level health dashboard
- Node / GPU drilldown
- Historical analysis
- Alerts
- Search by cluster / node / GPU / job / model
- Multi-tenant access control
Non-Functional
- High write throughput
- Near-real-time freshness
- Durable ingestion
- Query latency target
- High availability
- Bounded storage cost
- Backpressure handling
- Regional fault isolation
2. Capacity Estimation
Practice this calculation without notes.
10,000 nodes
8 GPUs / node
100 metrics / GPU
1 sample / second
10,000 × 8 × 100
= 8,000,000 metric values / second
Assuming roughly 16 bytes encoded per datapoint:
8M × 16 bytes
≈ 128 MB / second
≈ 11 TB / day
Interview Insight
This immediately motivates:
- downsampling
- compression
- aggregation
- hot / warm / cold tiers
- retention policy
- debug-mode admission control
3. High-Level Architecture
GPU Node
  │
  ├─ DCGM / Local Agent
  │
  ▼
Regional Collector
  │
  ▼
Kafka / Pulsar
  │
  ├────────► Stream Processor ───► Alert Engine
  │
  ├────────► Hot Time-Series Store
  │
  └────────► Object Storage / Data Lake
                     │
                     ▼
              Historical Analytics

React Dashboard
      │
API Gateway
      │
Query Service
      │
 ┌────┴───────────────┐
 │                    │
Hot Metrics      Historical Store
4. Storage Strategy
Practice defending a tiered policy.
| Resolution | Example Retention | Usage |
|---|---|---|
| 1 sec | 24–72 hours | Active debugging |
| 10 sec | 7 days | Recent incidents |
| 1 min | 30–90 days | Operational trends |
| 1 hour | 1 year | Capacity planning |
Discuss
- TSDB vs ClickHouse
- Columnar analytics database
- Object storage + Parquet
- Pre-aggregated rollups
- Compression
- Late-arriving data
5. Reliability
Be ready for:
What happens if the collector loses connectivity?
Answer with:
Local buffer
→ bounded disk queue
→ retry with backoff
→ batch upload after reconnect
→ sequence IDs / timestamps
→ deduplicate downstream
Discuss:
- At-least-once ingestion
- Idempotency
- Duplicate events
- Out-of-order events
- Backpressure
- Dead-letter handling
Day 2 Mock Follow-Ups
- What if the cluster grows to 100,000 GPUs?
- What if every user enables 1-second debugging?
- What is your partition key?
- How do you prevent hot partitions?
- What if Kafka is unavailable?
- How do alerts work during ingestion lag?
- How do you monitor your monitoring system?
Day 3 — Backend, API, Cache, RBAC, Multi-Tenancy
Objective
Connect backend architecture directly to observability UX.
1. API Design
Practice designing APIs like:
GET /clusters/:clusterId/metrics
GET /nodes/:nodeId/gpus
GET /gpus/:gpuId/metrics
GET /jobs/:jobId/metrics
GET /models/:modelId/metrics
GET /alerts
Time-series query:
GET /metrics?
entity=gpu-231&
metrics=gpu_util,memory_util,temp&
from=...&
to=...&
resolution=10s
Discuss:
- Time-range limits
- Server-side aggregation
- Pagination
- Response compression
- Query timeout
- Query budget
- Cancellation
2. Cache Strategy
Know where each layer helps.
Browser memory cache
        ↓
Client query cache
        ↓
CDN / HTTP cache
        ↓
API result cache
        ↓
Database / TSDB
Practice Talking Points
- Short-range historical queries can be cached.
- Live metrics should have short TTL or streaming updates.
- Cache keys must include tenant, entity, metric set, time range, resolution.
- Avoid caching authorization-sensitive data across tenants.
3. Cardinality
This is a major observability topic.
Low-to-medium cardinality labels:
cluster_id
node_id
gpu_id
job_id
model_id
region
Dangerous labels:
request_id
prompt_id
session_id
trace_id
arbitrary user input
Strong Answer
I keep low-cardinality dimensions in time-series indexes and move high-cardinality diagnostic metadata into logs or tracing systems where the access pattern better fits that data.
4. Multi-Tenant RBAC
Practice:
User
 ↓
Org / Tenant
 ↓
Cluster
 ↓
Job / Model
 ↓
GPU telemetry
Discuss:
- Tenant isolation
- Resource ownership
- Read permissions
- Admin / operator / viewer roles
- Audit trail
- Query filters enforced server-side
Day 3 Practice Questions
- How do you version your telemetry APIs?
- How do you prevent one user from issuing a massive query?
- How does cache invalidation work for live telemetry?
- How do you protect cross-tenant data?
- How would you expose aggregated metrics vs raw metrics?
Day 4 — Frontend Observability Dashboard
Core Prompt
Design a React dashboard for monitoring 10,000 GPUs in real time.
1. Information Hierarchy
Avoid rendering 10,000 charts.
Use drilldown:
Cluster
  ↓
Rack / Group
  ↓
Node
  ↓
GPU
  ↓
Metric Timeline
2. Dashboard Layout
Example:
┌─────────────────────────────────────────────┐
│ Cluster Health                              │
│ 742 healthy | 18 degraded | 3 unavailable │
└─────────────────────────────────────────────┘

GPU Utilization         Temperature
███████ 83%             █████ 72°C

HBM Memory              Training Failures
██████ 74%              12
3. React Architecture
Practice explaining:
App
 ├─ Filter / TimeRange Context
 ├─ ClusterSummary
 ├─ HealthGrid
 ├─ GPUVirtualizedTable
 ├─ MetricChart
 └─ AlertPanel
State categories:
- URL state
- local UI state
- server state
- streaming state
4. Performance
For 10k entities:
- Server-side aggregation
- Virtualized tables
- Progressive drilldown
- Avoid one network request per row
- Shared subscription
- Batch state updates
- requestAnimationFrame for chart rendering
- Limit visible datapoints
- Downsample chart data
- Web Worker for expensive aggregation
- Memoization only where measured
5. SSE vs WebSocket vs Polling
Polling
Good when:
- freshness requirements are low
- infrastructure simplicity matters
Problems:
- repeated requests
- synchronized load spikes
- stale intervals
SSE
Good when:
- server → client streaming
- metrics / alerts are push-only
- simple HTTP semantics are valuable
Discuss:
- reconnection
- Last-Event-ID
- event ordering
- backpressure strategy
WebSocket
Good when:
- bidirectional real-time interaction
- control-plane commands
- many interactive messages
6. Accessibility
Do not ignore a11y in observability dashboards.
- Charts have textual equivalents
- Status is not color-only
- Keyboard navigation
- Focus management
- Screen-reader labels
- Live updates do not spam ARIA live regions
- Contrast-safe severity indicators
Day 4 Practice Questions
- How do you render 100k metric points smoothly?
- When do you use Canvas instead of SVG?
- How do you avoid rerendering the entire dashboard on every SSE message?
- How do you recover after the browser loses connectivity?
- How would you support shareable dashboard URLs?
Day 5 — Coding + Streaming Data Processing
Target Split
60% DS&A
40% Observability-flavored practical coding
Core Problems
Complete each without AI first.
- Sliding Window Maximum
- Moving Average
- Top K Frequent / Top K Metrics
- LRU Cache
- Rate Limiter
- Merge Sorted Streams
- Event Deduplication
- Producer / Consumer Queue
- Bounded Queue
- Retry with Exponential Backoff
- Concurrent API Aggregator
Practical Exercise 1 — GPU Aggregation
Input:
[
  { gpu: 0, ts: 1, utilization: 75 },
  { gpu: 1, ts: 1, utilization: 92 },
  { gpu: 0, ts: 2, utilization: 81 },
];
Return:
{
  0: {
    avg: 78,
    max: 81,
  },
  1: {
    avg: 92,
    max: 92,
  },
}
Follow-Ups
- Dataset does not fit memory
- Events arrive out of order
- Duplicate events
- Parallel processing
- Sliding 5-minute window
- Late arrivals
Practical Exercise 2 — Top GPUs Over Sliding Window
Process a stream of GPU metrics and return the top five GPUs by average utilization over the last five minutes.
Clarify:
- stream ordering
- event timestamps
- duplicates
- retention
- memory constraints
- exact vs approximate top-K
Coding Interview Checklist
Before coding:
- Restate problem
- Ask about constraints
- Give brute-force approach
- Improve approach
- State time complexity
- State space complexity
While coding:
- Use meaningful names
- Handle edge cases
- Avoid overengineering
- Speak through invariants
After coding:
- Walk through example
- Test empty input
- Test one element
- Test duplicates
- Explain scaling follow-up
Day 6 — AI Workload Debugging + LLM Observability
Objective
Be able to answer:
Why is my training job or LLM inference service slow?
1. Three-Layer Model
Model Quality
loss
accuracy
perplexity
evaluation score
drift
Serving Performance
TTFT
tokens/sec
request latency
queue latency
batch size
GPU utilization
KV-cache utilization
OOM
Infrastructure
GPU health
HBM
network
NCCL
CPU
storage
power
thermal limits
2. Diagnostic Tree
Training Slow
│
├─ GPU utilization low
│   ├─ data loader bottleneck
│   ├─ CPU bottleneck
│   ├─ storage bottleneck
│   └─ synchronization / network
│
├─ GPU utilization high
│   ├─ compute-bound
│   ├─ memory-bandwidth-bound
│   └─ inefficient kernels
│
└─ uneven GPUs
    ├─ straggler worker
    ├─ thermal throttling
    ├─ NCCL / network problem
    └─ hardware degradation
3. LLM Inference Scenarios
Scenario A
Latency ↑
GPU utilization ↓
Queue depth ↑
Possible causes:
- CPU/tokenizer bottleneck
- scheduler issue
- network bottleneck
- batching inefficiency
Scenario B
Latency ↑
GPU utilization ≈ 100%
HBM ≈ 100%
Possible causes:
- GPU saturation
- insufficient capacity
- batch too large
- memory pressure
4. Natural-Language Observability Assistant
Possible future feature:
“Why was training job J123 slow yesterday?”
Architecture:
User Question
    ↓
LLM Planner
    ↓
Allowed Query Tools
    ↓
Metrics / Logs / Traces
    ↓
Correlation / Analysis
    ↓
Grounded Explanation
Guardrails
- RBAC enforced outside LLM
- Read-only query tools
- Query cost limit
- Time-range limit
- Allowed datasets
- SQL validation
- Audit log
- Response cites actual metrics
- No unrestricted arbitrary execution
Day 6 Practice Questions
- How would you identify a slow GPU in distributed training?
- What does NCCL contribute to observability?
- How would you find the root cause of TTFT regression?
- What is the difference between model quality monitoring and infrastructure monitoring?
- How do you safely expose observability data to an AI assistant?
Day 7 — Full Mock Onsite
Simulate the actual interview day.
Session 1 — Coding — 45 Minutes
Prompt:
Process a stream of GPU utilization events and return the top five GPUs by average utilization over the last five minutes.
Score yourself:
| Dimension | Score 1–5 |
|---|---|
| Clarification | |
| Algorithm | |
| Code quality | |
| Complexity | |
| Edge cases | |
| Communication |
Session 2 — System Design — 60 Minutes
Prompt:
Design GPU Observability Platform for 100,000 GPUs.
Hit these sections in order:
- Requirements
- Capacity estimation
- API
- Ingestion
- Stream processing
- Storage
- Query service
- Alerting
- Reliability
- Multi-tenancy
- Cost control
- Monitoring the monitoring system
Score
| Dimension | Score 1–5 |
|---|---|
| Requirements | |
| Scale estimation | |
| Architecture | |
| Tradeoffs | |
| Reliability | |
| Cost awareness | |
| Communication |
Session 3 — Frontend Design — 45 Minutes
Prompt:
Build a GPU cluster health dashboard that supports thousands of GPUs and real-time updates.
Cover:
- User flows
- Component architecture
- API contracts
- Streaming
- Caching
- Virtualization
- Chart rendering
- Accessibility
- Error handling
- Testing
- Performance
Session 4 — Behavioral — 45 Minutes
Prepare six stories.
Story 1 — Architecture Decision
- Situation:
- Task:
- Action:
- Result:
- What I would change:
Story 2 — Production Incident
- Situation:
- Task:
- Action:
- Result:
- What I would change:
Story 3 — Cross-Team Disagreement
- Situation:
- Task:
- Action:
- Result:
- What I would change:
Story 4 — Scaling / Performance Improvement
- Situation:
- Task:
- Action:
- Result:
- What I would change:
Story 5 — Ambiguous Project
- Situation:
- Task:
- Action:
- Result:
- What I would change:
Story 6 — Mentoring / Technical Influence
- Situation:
- Task:
- Action:
- Result:
- What I would change:
High-Priority Whiteboard Questions
You should be able to answer each without preparation.
- Design GPU telemetry infrastructure for 100k GPUs.
- How would you identify a slow GPU in distributed training?
- Prometheus vs ClickHouse vs Snowflake for telemetry?
- How would you store 1-second metrics for three months?
- How do you prevent metric-cardinality explosion?
- How do you build alerting without alert storms?
- How do you correlate GPU metrics with training jobs?
- How would you build a React dashboard for 10k GPUs?
- Polling vs SSE vs WebSocket?
- What happens when collectors lose connectivity?
- How do you handle duplicate and out-of-order telemetry?
- How do you monitor the observability platform itself?
- How do you implement tenant-level RBAC?
- How would an AI assistant safely query telemetry?
- Why is my training job slow?
System Design Interview Template
Use this sequence every time.
1. Clarify
Who are the users?
What entities are monitored?
How fresh must the data be?
What retention is required?
What is the expected scale?
2. Estimate
GPUs
× metrics/GPU
× samples/sec
× bytes/sample
3. Define APIs
read cluster summary
read entity metrics
read alerts
subscribe to live metrics
4. Draw Core Architecture
Agent
→ Collector
→ Queue
→ Processor
→ Storage
→ Query Service
→ Dashboard
5. Deep Dive
Choose 2–3:
- ingestion reliability
- TSDB choice
- downsampling
- alerting
- caching
- multi-tenancy
- frontend streaming
6. Failure Modes
collector down
queue overloaded
storage unavailable
query storm
tenant abuse
network partition
browser disconnect
7. Tradeoffs
Always finish with explicit tradeoffs.
AI Observability Cheat Sheet
GPU
Utilization
SM utilization
Tensor Core utilization
HBM usage
HBM bandwidth
PCIe
NVLink
Temperature
Power
ECC
XID
MIG
Training
step time
samples/sec
tokens/sec
GPU idle
loader latency
all-reduce latency
NCCL
checkpoint
stragglers
loss
Inference
RPS
TTFT
inter-token latency
tokens/sec
queue depth
batch size
KV cache
OOM
p99
Platform
ingestion lag
queue depth
consumer lag
write failures
query latency
storage growth
alert delay
dropped telemetry
Final 24-Hour Checklist
Technical
- Can explain GPU + AI metric hierarchy from memory
- Can design telemetry platform in 45 minutes
- Can estimate 100k-GPU ingestion volume
- Can explain hot / warm / cold retention
- Can explain cardinality
- Can explain SSE vs WebSocket
- Can design React dashboard for 10k GPUs
- Can explain slow-training diagnostic tree
- Can explain safe AI observability assistant
Coding
- Sliding window problem
- Top-K problem
- Aggregation problem
- LRU / cache problem
- Queue / producer-consumer problem
Behavioral
- Six STAR stories prepared
- Each story has measurable impact
- Each story explains personal contribution
- Each story has a lesson / tradeoff
Interview Communication
- Clarify before solving
- State assumptions
- Start simple
- Quantify scale
- Explain tradeoffs
- Pause after major sections
- Invite interviewer to choose deep dive
- Avoid over-answering before the interviewer asks
Daily Study Log
| Date | Focus | Minutes | Confidence 1–5 | Weakest Area | Next Action |
|---|---|---|---|---|---|
Final Readiness Scorecard
Rate yourself honestly from 1–5.
| Skill | Score |
|---|---|
| GPU architecture | |
| AI training observability | |
| LLM inference observability | |
| Distributed telemetry design | |
| Time-series storage | |
| Streaming / Kafka | |
| API design | |
| Multi-tenancy / RBAC | |
| Frontend system design | |
| React performance | |
| SSE / WebSocket | |
| Coding | |
| Behavioral communication |
Target Before Interview
Aim for:
No category below 3
Core categories ≥ 4
Core categories:
GPU observability
Distributed telemetry design
Coding
Frontend architecture
Diagnostic reasoning
One-Minute Mental Model Before Walking In
AI workload
    ↓
Model metrics
    +
GPU / infrastructure metrics
    +
Logs / traces
    ↓
Telemetry pipeline
    ↓
Stream processing
    ↓
Hot + historical storage
    ↓
Query / alert service
    ↓
React observability UX
    ↓
Human or AI-assisted diagnosis
The strongest Senior Full Stack answer connects all of these layers, explains where bottlenecks occur, and makes explicit tradeoffs around scale, correctness, reliability, UX, and cost.